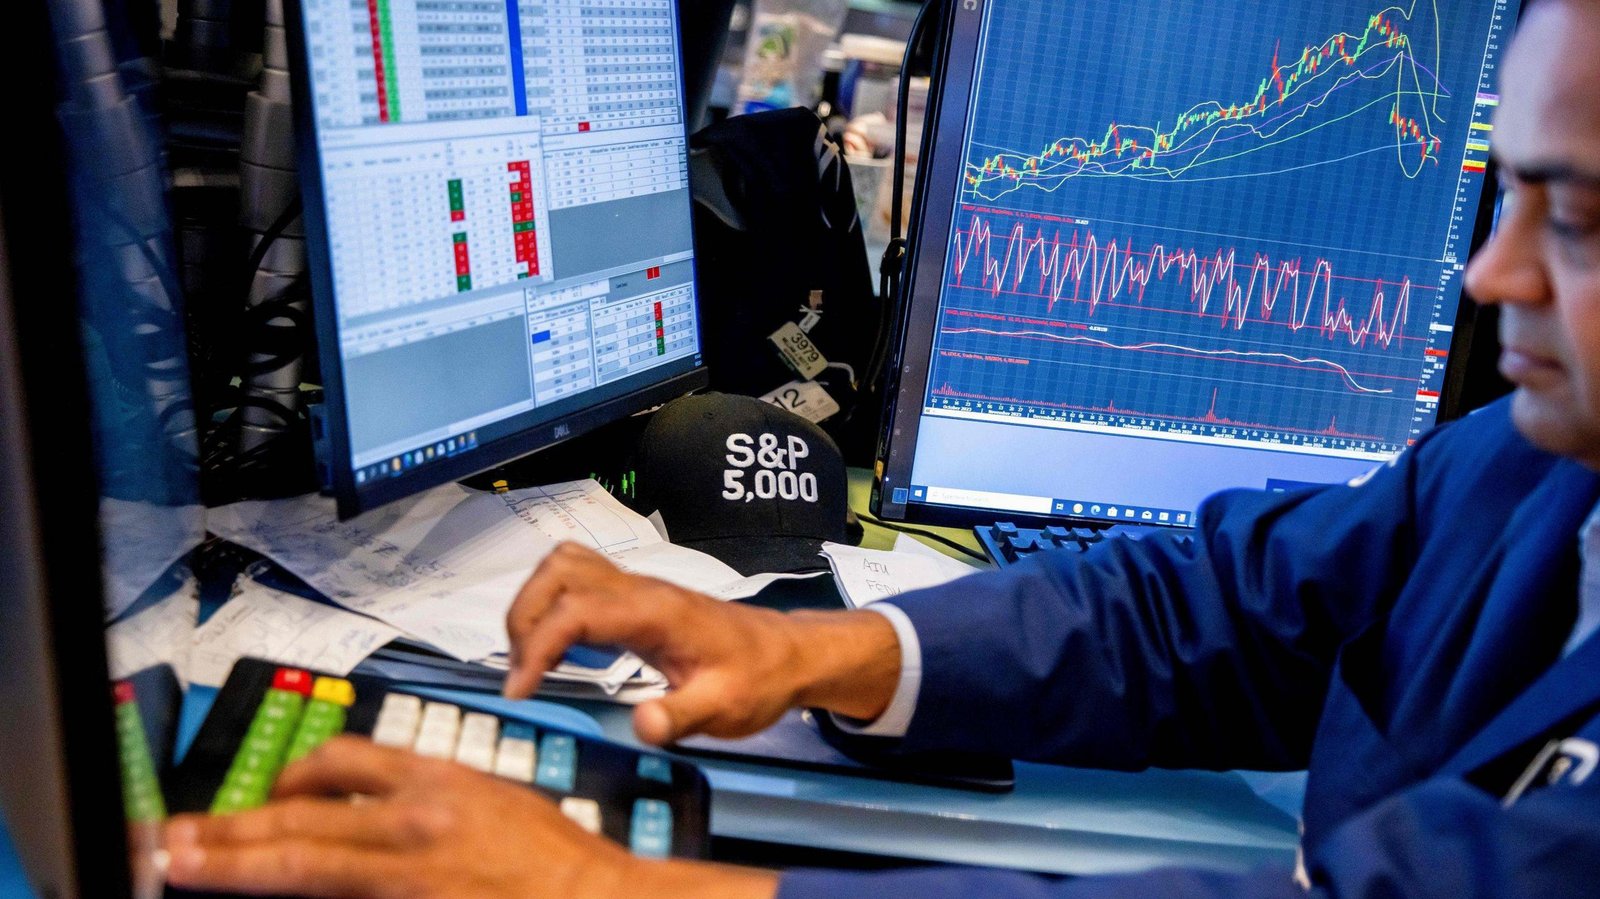
Many traders start their journey by adding more and more indicators to their charts — RSI, MACD, Bollinger Bands, and dozens more.
But experienced traders often move in the opposite direction.
They simplify.
Welcome to price action trading — one of the most respected and widely used approaches in the market.
Price action focuses on the most important data point of all:
The price itself.
In 2026, despite the rise of AI tools and complex algorithms, price action remains a core skill for discretionary traders because it reflects real-time market psychology.
This guide will teach you how price action works, how to read clean charts, and how beginners can start using it effectively.
What Is Price Action Trading?
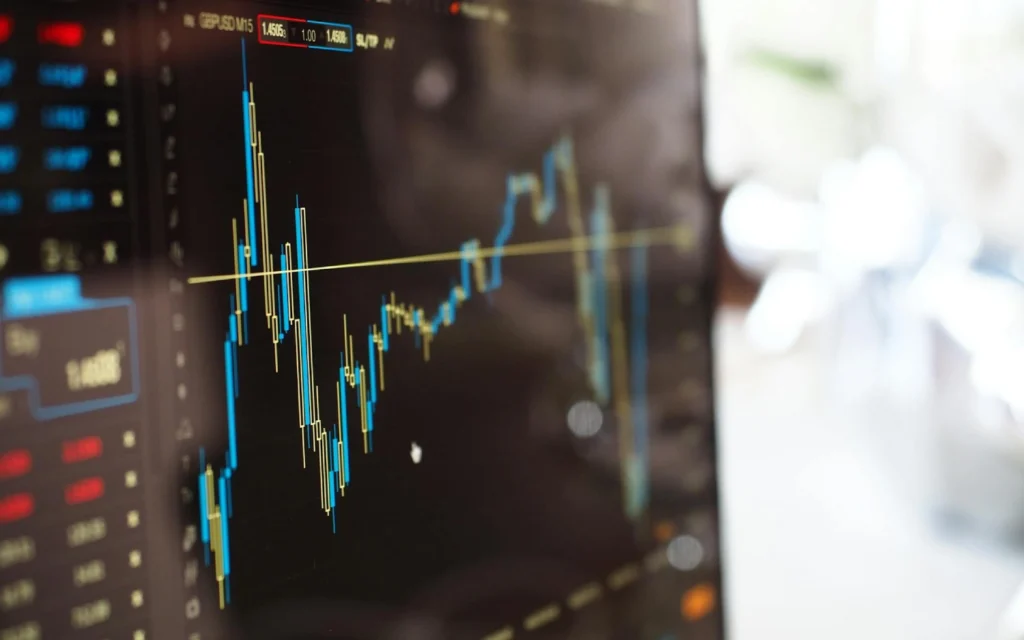
Price action trading is the practice of making trading decisions based primarily on raw price movement rather than relying heavily on indicators.
Price action traders focus on:
-
Candlestick behavior
-
Market structure
-
Support and resistance
-
Trend patterns
-
Breakouts and rejections
The philosophy is simple:
Price tells the story first. Indicators only interpret it later.
Why Price Action Still Works in 2026
Even in highly automated markets, price action remains powerful because markets are still driven by human behavior and institutional order flow.
Key Reasons It Persists
-
Reflects real-time supply and demand
-
Shows institutional footprints
-
Reduces indicator lag
-
Works across timeframes
-
Keeps charts clean and readable
Many professional traders use price action as their primary framework.
The Foundation: Market Structure
Before looking at candlesticks, understand structure.
Uptrend Structure
Defined by:
-
Higher highs
-
Higher lows
Bias: look for buying opportunities.
Downtrend Structure
Defined by:
-
Lower highs
-
Lower lows
Bias: look for caution or short setups.
Range-Bound Market
Price moves sideways between support and resistance.
Bias: range trades or wait for breakout.
Support and Resistance: Your Roadmap
These levels are critical in price action trading.
Support
A level where buyers historically step in.
Think of it as a floor.
Resistance
A level where sellers tend to appear.
Think of it as a ceiling.
Why These Levels Matter
They often align with:
-
Institutional orders
-
Psychological price levels
-
Previous highs/lows
-
Supply and demand zones
Price action traders always mark these first.
Key Candlestick Patterns Every Beginner Should Know
Candles reveal short-term market psychology.
Bullish Pin Bar (Hammer)
What it shows:
-
Strong rejection of lower prices
-
Buyers stepping in
Where it works best:
-
At support
-
In uptrends
Bearish Pin Bar (Shooting Star)
What it shows:
-
Rejection of higher prices
-
Sellers gaining control
Best location:
-
At resistance
-
In downtrends
Engulfing Pattern
A powerful reversal signal.
Bullish engulfing:
-
Large green candle engulfs prior red candle
Bearish engulfing:
-
Large red candle engulfs prior green candle
Context matters — location is key.
The Price Action Trading Process
Follow this simple workflow.
Step 1: Identify the Trend
Ask first:
-
Uptrend?
-
Downtrend?
-
Range?
Trading with the trend improves probabilities.
Step 2: Mark Key Levels
Draw:
-
Support
-
Resistance
-
Previous highs/lows
-
Trendlines (optional)
Step 3: Wait for Price to Reach a Key Area
Patience is critical.
Price action traders do not chase.
They wait for price to come to them.
Step 4: Look for Confirmation
Examples:
-
Pin bar
-
Engulfing candle
-
Strong rejection wick
-
Breakout with momentum
Step 5: Define Risk Before Entry
Always know:
-
Where you are wrong
-
Where your stop loss goes
-
Your risk-to-reward ratio
Risk Management in Price Action Trading
Clean charts do NOT mean careless risk.
Position Sizing
Many traders risk:
1–2% per trade
Stop Loss Placement
Common locations:
-
Beyond support/resistance
-
Beyond candle wick
-
Beyond structure level
Risk-to-Reward Ratio
Many traders aim for:
Minimum 1:2
Example:
-
Risk $100
-
Target $200
Common Price Action Mistakes
Avoid these beginner traps.
Trading Without Context
Patterns alone are not enough.
Location matters more than the candle itself.
Forcing Trades
Not every level is tradable.
Patience is an edge.
Ignoring the Trend
Countertrend trades are harder.
Overtrading
Quality setups are rare.
Moving Stop Loss Emotionally
This destroys risk control.
Price Action vs Indicator Trading
| Feature | Price Action | Indicator-Based |
|---|---|---|
| Lag | Minimal | Often lagging |
| Chart clarity | Clean | Often cluttered |
| Learning curve | Moderate | Moderate |
| Signal speed | Fast | Slower |
| Flexibility | High | Moderate |
Many traders combine both approaches.
Is Price Action Good for Beginners?
Yes — especially if you prefer simplicity.
Good Fit If You:
-
Like clean charts
-
Enjoy pattern recognition
-
Can be patient
-
Want fewer indicators
-
Focus on risk management
Challenging If You:
-
Want constant signals
-
Prefer fully mechanical systems
-
Struggle with discretion
Price Action in Modern Markets (2026)
Despite AI and automation, price action remains widely used by:
-
Discretionary traders
-
Institutional desks
-
Swing traders
-
Futures traders
-
Forex traders
Technology has changed tools — not human psychology.
Price action trading strips the market down to its most essential element: price itself. For many traders, this clarity becomes a major advantage.
Success comes from mastering a simple process:
-
Understand the trend
-
Mark key levels
-
Wait patiently
-
Confirm with price behavior
-
Manage risk strictly
You don’t need dozens of indicators to trade effectively. Often, less really is more.