For many new investors, the stock market feels like a high-stakes guessing game. You see a stock trading at $10 and think it’s a bargain, while a stock at $500 seems “expensive.” However, in the professional world of finance, the price tag on a single share tells you almost nothing about whether the stock is actually a good deal.
To build real wealth, you must understand the difference between price and value. As legendary investor Warren Buffett famously said, “Price is what you pay; value is what you get.” In this guide, we will walk through the essential metrics, psychological factors, and qualitative signs that indicate a stock is trading for less than it is actually worth.
Understanding the Difference Between Price and Value

Before diving into the math, we must clarify a fundamental concept: a low share price does not mean a stock is “cheap.”
Imagine two companies. Company A has a share price of $5. Company B has a share price of $500. If Company A is losing money and has massive debt, that $5 might be overpriced. If Company B is a global leader with billions in profit and a dominant market share, that $500 might be a steal.
Finding a “cheap” stock means finding an undervalued asset—a company whose intrinsic worth is higher than what the current market price suggests. This is the core of “Value Investing,” a strategy popularized by Benjamin Graham and Warren Buffett.
Essential Valuation Multiples Every Investor Should Know
To determine if a stock is cheap, you need to look at “multiples.” These are ratios that compare the stock price to a specific financial metric, like earnings or sales.
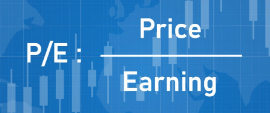
The Price-to-Earnings (P/E) Ratio
The P/E ratio is the most common tool used to value stocks. It tells you how much investors are willing to pay for every $1 of the company’s annual profit.
-
Trailing P/E: Based on the last 12 months of earnings.
-
Forward P/E: Based on predicted future earnings.
Generally, a lower P/E ratio compared to the company’s historical average or its industry peers suggests the stock might be cheap. For example, if the average tech company has a P/E of 30 and you find a growing tech giant with a P/E of 15, it warrants further investigation.
The Power of the PEG Ratio for Growth Investors
The P/E ratio has one major flaw: it doesn’t account for how fast a company is growing. This is why many professional analysts prefer the PEG Ratio (Price/Earnings to Growth).
A company with a high P/E ratio might actually be “cheaper” than a low-P/E company if it is growing its earnings twice as fast.
-
A PEG ratio of 1.0 is generally considered “fairly valued.”
-
A PEG ratio below 1.0 suggests the stock is undervalued relative to its growth potential.
This is a vital tool for those looking at younger, high-growth companies in sectors like software or renewable energy.
Using Price-to-Book (P/B) for Asset-Heavy Industries
In industries like banking, insurance, or heavy manufacturing, the Price-to-Book ratio is a powerful indicator of value. This ratio compares the market’s valuation of the company to its “book value” (total assets minus total liabilities).
If a stock has a P/B ratio of less than 1.0, the market is essentially saying the company is worth less than the sum of its physical parts. While this can sometimes indicate a failing business, it can also signal a massive bargain where you are buying assets for cents on the dollar.
How to Calculate Intrinsic Value Using Discounted Cash Flow (DCF)
If ratios are the “shortcuts,” the Discounted Cash Flow (DCF) analysis is the “long way” to find a stock’s fair price. This method is based on a simple premise: a company is worth the sum of all the cash it will generate in the future, brought back to today’s value.
To perform a basic DCF, you:
-
Forecast the company’s “Free Cash Flow” for the next 5-10 years.
-
Assign a “Terminal Value” (what the company is worth at the end of that period).
-
Discount those future dollars back to the present using a “Discount Rate” (usually based on current interest rates and the company’s risk).
If your calculated intrinsic value is $120 and the stock is currently trading at $80, the stock is objectively cheap.
Analyzing a Company’s “Economic Moat” and Management
Numbers only tell half the story. A stock can be “cheap” on paper but remain cheap forever if the business has no competitive advantage. This is why you must look for an Economic Moat.
A moat is what protects a company from its competitors. Examples include:
-
Brand Loyalty: People will pay more for an Apple iPhone or a Starbucks coffee.
-
Network Effects: Platforms like Visa or Facebook become more valuable as more people use them.
-
Cost Advantages: Companies like Walmart or Amazon can underprice everyone else due to their massive scale.
If you find a company with a wide moat trading at a low P/E ratio, you have likely found a “cheap” stock that has the potential to grow for decades.
Avoiding the Value Trap: Why Low Prices Can Be Deceiving
The biggest danger in searching for cheap stocks is falling into a Value Trap. A value trap is a stock that looks cheap according to its ratios (low P/E, high dividend yield) but is actually a bad investment because the company’s business model is dying.
Signs of a Value Trap:
-
Declining Industry: A company making the best DVD players in the world is still in a dying industry.
-
Constant Revenue Decline: If sales are shrinking every year, the low P/E ratio is just reflecting the market’s lack of faith.
-
High Debt: A company might look cheap, but if all its cash goes toward paying interest on loans, it can’t grow.
Sector-Specific Valuations: Comparing Apples to Apples
You cannot compare the P/E of a utility company to the P/E of a biotech startup. Each sector has its own “valuation baseline.”
-
Utility Stocks: Usually have low P/E ratios (10-15) because they grow slowly and pay high dividends.
-
Technology Stocks: Often have high P/E ratios (30-100) because investors expect massive future growth.
-
Banking: Valued primarily on P/B ratios and “Net Interest Margin.”
To know if a stock is cheap, always compare it to its direct competitors within the same sector.
The Role of Macroeconomics: Interest Rates and Inflation
Sometimes a stock becomes cheap not because of anything the company did, but because of the “macro” environment.
When interest rates rise, valuations generally fall. This is because “safe” investments like Treasury Bonds offer higher returns, making “risky” investments like stocks less attractive. This can create opportunities to buy high-quality companies at a discount simply because the general market is in a “risk-off” mood.
Inflation and Pricing Power
In times of high inflation, a stock is “cheap” if the company has pricing power. If a company can raise its prices without losing customers (like a utility or a luxury brand), its value will hold up better than a company with thin margins that can’t pass costs to consumers.
Practical Steps to Start Finding Bargains Today

If you are ready to start looking for undervalued stocks, follow this step-by-step checklist:
-
Use a Stock Screener: Tools like Finviz or Yahoo Finance allow you to filter stocks by “P/E under 15” or “PEG under 1.”
-
Look for “Market Overreactions”: When a good company has one bad quarter and the stock drops 20%, it is often a great time to buy the dip.
-
Read the Annual Report (10-K): Look for the company’s “Risk Factors” and “Management Discussion.”
-
Check Insider Buying: If the CEO and CFO are buying shares of their own company with their own money, it’s a strong signal they believe the stock is too cheap.
Patience is the Investor’s Best Friend
Knowing if a stock is cheap is a skill that combines mathematical analysis with psychological discipline. The market is often emotional—swinging from extreme greed to extreme fear. The job of the value investor is to remain rational, looking at the fundamentals while others look at the headlines.
Finding a cheap stock is only the first half of the battle. The second half is having the patience to wait for the rest of the world to realize the company’s true value.